Hi from the Wet Coast. I've been travelling for a few days so the blog has been quiet.
I have, however, been pondering the matter of comparables that was discussed in the comments of the (second) Smid post. Popularized if not introduced by Bill James, the method is particularly useful in baseball where players are measured across a wide range of statistical categories.
Here's a simple example: Who is the best hitter in baseball?
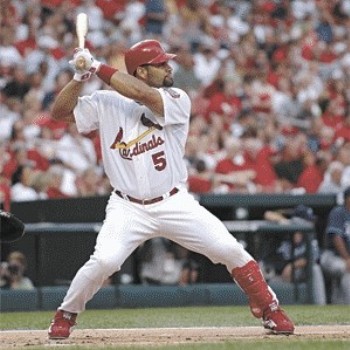
To answer such a question I like to look right across the spectrum of offensive stats and spot those who contribute across the board without apparent weakness. As a Cards fan it's natural for me to start with the guy pictured above, Albert Pujols.
Albert had an exceptional 2008 season, even by his own exceptionally high standards. While playing his usual glittering defence (1st in the majors at his position in both range factor and zone rating, tied for 1st in the NL in fielding percentage), Albert brought a mighty big stick to home plate for the eighth consecutive season. He finished among the offensive leaders in virtually every significant (positive) category and in a class all his own in my favourite stat, OPS. I like to group the important stats into logical clusters:
524 AB (49th NL / 91st MLB) 1.J Reyes 688
187 H (3rd / 7th) 1.I.Suzuki/D.Pedroia 213
81 XB (2nd / 3rd) 1.R.Braun 83
37 HR (4th / 4th) 1.R.Howard 48
49th in AB, 3rd in hits. Albert is always a little ways down the AB list because so many of his plate appearances end in walks. In 2008 Pujols had a stint on the 15-day DL which depressed all of his raw numbers totals by close to 10%.
100 R (14th / 27th) 1.H.Ramirez 125
116 RBI (4th / 9th) 1.R.Howard 146
Run production numbers always depend on the other hitters in the line-up, and players on high-scoring teams are favoured. It's no mean feat to make the 100 + 100 standard; just 13 major leaguers did so in 2008. Among them, just the also-injured Alex Rodriguez did so in fewer ABs (510) than Albert.
104 BB (2nd / 3rd) 1.A.Dunn 122
54 K (116th / 243rd) 1.M.Reynolds 204
That last category is nothing short of scary. Of the 14 players in baseball who drew over 90 walks in 2008, the other 13 all had over 90 strikeouts as well, averaging 129 K's among them. Albert's 54 was at barely 40% of the norm. Considering the number of pitches he takes and how hard he swings, that's astonishing.
.357 AVG. (2nd / 2nd) 1. C.Jones .364
.462 OBP (2nd / 2nd) 1. C. Jones .470
.653 SLG (1st / 1st) 2. M.Ramirez .601
1.114 OPS (1st / 1st) 2. C.Jones 1.044
Percentage stats iron out the differentials in GP, AB etc. which may have been impacted by injury. The playing field thus levelled, Albert's performance is revealed as across-the-board spectacular.
***
Comparing on a player-by-player basis, there are a few individuals whose performance is equal or even better than Albert's among the various clusters of stats presented above. How did they compare across the board?
Player** AB* H** XB HR | R** RBI | BB* K** |
AVG* OBP* SLG* OPS**
--------------------------------------------
A.Pujols 524 187 81 37 | 100 116 | 104 054 |
.357 .462 .653 1.114
C. Jones 439 160 47 22 | 082 075 | 090 061 |
.364 .470 .574 1.044
Chipper won the batting title -- thanks in part to his protecting the lead by sitting in the dugout down the stretch, the gutless puke -- and posted some pretty nice percentages and a decent BB:K ratio. But his power and run production fell far short.
Player** AB* H** XB HR | R** RBI | BB* K** |
AVG* OBP* SLG* OPS**
--------------------------------------------
A.Pujols 524 187 81 37 | 100 116 | 104 054 |
.357 .462 .653 1.114
R.Howard 610 153 78 48 | 105 146 | 081 199 |
.251 .339 .543 0.881
Howard is an MVP favourite for his great production numbers in the middle of a potent Philllie lineup. But he was over 100 points shy of Albert in batting average, and even more than that in both OBP and SLG. As for those 199 strikeouts, say no more.
Player** AB* H** XB HR | R** RBI | BB* K** |
AVG* OBP* SLG* OPS**
--------------------------------------------
A.Pujols 524 187 81 37 | 100 116 | 104 054 |
.357 .462 .653 1.114
ARod**** 510 154 68 35 | 104 103 | 065 117 |
.302 .392 .573 0.965
Like Albert, ARod missed a little time and still managed to post yet another .300-30-100-100 season. But in 2008 it was really no contest between these two greats of our time.
Player** AB* H** XB HR | R** RBI | BB* K** |
AVG* OBP* SLG* OPS**
--------------------------------------------
A.Pujols 524 187 81 37 | 100 116 | 104 054 |
.357 .462 .653 1.114
MRamirez 552 183 74 37 | 102 121 | 087 124 |
.332 .430 .601 1.031
Now here's a decent comparison. Manny posted his numbers across two leagues, closing with a flourish in L.A. His percentages are a little shy of Albert's across the board, but at least they're in the neighbourhood, while the production numbers of the two are very similar. Again there is a huge differential in BB:K ratio, but no comparison is perfect.
***
Turning to career production, it's tough to compare guys at different stages of their careers. One possible method is to use the handy 162 Game Avg line courtesy of Baseball-Reference.com. Assuming full health, what's a typical season for these guys?
Player** AB* H** XB HR | R** RBI | BB* K** |
AVG* OBP* SLG* OPS**
--------------------------------------------
A.Pujols 599 200 89 42 | 124 128 | 091 066 |
.334 .425 .624 1.049
MRamirez 586 184 81 41 | 111 133 | 093 128 |
.314 .411 .593 1.004
Once again Manny is a good comparison, although as was the case in 2008 he falls a little short in all percentage categories. Production numbers are fairly similar, although Manny has generally played on a high-powered line-up, and unlike Albert has benefitted from playing in a hitter's park for much of his career.
Player** AB* H** XB HR | R** RBI | BB* K** |
AVG* OBP* SLG* OPS**
--------------------------------------------
A.Pujols 599 200 89 42 | 124 128 | 091 066 |
.334 .425 .624 1.049
ARod**** 624 191 80 44 | 127 127 | 078 130 |
.306 .389 .578 0.967
Many consider ARod the best player in baseball, but again we see Albert with a nice edge in batting average that is larger still in both OBP and SLG. Production numbers are very similar indeed. Of course ARod has been doing it for longer, so Albert has to prove he can keep doing it, but all the arrows do seem to be pointed in that direction. He puts up big numbers across the spectrum with Brodeur-like consistency.
Player** AB* H** XB HR | R** RBI | BB* K** |
AVG* OBP* SLG* OPS**
--------------------------------------------
A.Pujols 599 200 89 42 | 124 128 | 091 066 |
.334 .425 .624 1.049
B. Bonds 534 159 78 41 | 121 108 | 139 083 |
.298 .444 .607 1.051
Finally an "active" (unretired) player who outperforms even Albert in the BB:K dept., and the walk machine has the on-base percentage to prove it. Albert has a significant edge in hits and batting average to balance the scales. Even with the four "superhuman" years 2001-04, in which Bonds posted the 1st, 3rd, 4th and 8th best OPS seasons in major league history, the two are a virtual saw-off in that significant category over the course of their careers. The comp isn't perfect, but I think it's fair to say that across the offensive spectrum Albert compares pretty darn well to the seven-time MVP.
***
So what about comparables in hockey? That's a whole 'nother essay, better saved for another day.

9 comments:
I have been working on comparables for a while in hockey and the more I get into it I find that it is just so hard. The lack of statistics from years past makes any kind of numbers evaluation very offensively/ points wise oriented. The work that Behind the Net is doing is great but as of yet we still haven't, as a group, even decided what stats to keep, how to express them and if they are relevant. There is some great work going on at BofA by Matt to clarify this situation. The fact that hockey is also such a fluid game also makes this difficult. Every player is used in different situations and this will drastically affect their counting numbers. Also, in hockey, players play the same position and have different roles. Phil Housely and Scott Stevens are drastically different players, to the outside offensively slanted observed Housley would probably be considered superior.
Anyway, an interesting subject and I enjoyed your take on Smid.
Hi Matt N and welcome. I agree with you on virtually every count. In hockey the historical stats don't have a lot of breadth outside of the offensive game, and the new stats that have been developed to measure some of these areas don't have much history. Whereas in baseball all the stats I cited have either been kept forever or can be calculated from the existing numbers. e.g. here's the list of career leaders in OPS, a stat that was "invented" in 1984:
1. Babe Ruth+* 1.1638 L
2. Ted Williams+* 1.1155 L
3. Lou Gehrig+* 1.0798 L
4. Barry Bonds* (43) 1.0512 L
5. Albert Pujols (28) 1.0489 R
6. Jimmie Foxx+ 1.0376 R
7. Hank Greenberg+ 1.0169 R
8. Rogers Hornsby+ 1.0103 R
9. Manny Ramirez (36) 1.0044 R
10. Todd Helton* (34) 1.0020 L
(re: Helton, can you say "park effects"?)
The work that Behind the Net is doing is great but as of yet we still haven't, as a group, even decided what stats to keep, how to express them and if they are relevant.
An extremely good point. A key development will be in determining what "basket" of stats might make the most useful comps for players of a given position. Such comps will be virtually impossible across eras.
The other challenge as you imply will be in agreeing on what's important; e.g. the ongoing debate about whether Sv% is Everything when it comes to measuring goalies, or merely one important yardstick.
If it wasn't for The Steroid, Pujols would likely be a 3 or 4 time MVP right now...he's the best hitter in baseball. No Vladdy comparison?
Oilman: Not much of a comp between Albert (1.114 OPS) and Vladdy (0.886) in 2008. But since you asked, here's their per-162 comp:
Player AB* H** XB HR | R** RBI | BB K* |
AVG* OBP* SLG* OPS**
----------------------------------------------------
Albert 599 200 89 42 | 124 128 | 91 66 |
.334 .425 .624 1.049
Vladdy 613 198 77 37 | 104 117 | 62 75 |
.323 .389 .575 0.964
... and you'll see it's Albert across the board. Vladdy's outstanding .323 career average keeps him respectable, but even here he falls short. He does come a hell of a lot closer than the active player with the second highest batting average:
Player AB* H** XB HR | R** RBI | BB K* |
AVG* OBP* SLG* OPS**
----------------------------------------------------
Albert 599 200 89 42 | 124 128 | 91 66 |
.334 .425 .624 1.049
Ichiro 691 228 42 09 | 112 059 | 48 67 |
.331 .377 .430 0.807
In this example you see a guy whose value is almost entirely locked up in his batting average, with neither walks nor Isolated Power enough to make his OBP or SLG particularly exceptional. Makes 60+ more outs a year than Albert while being involved in ~80 fewer runs. Good fielder, fine baserunner, but overrated as a hitter in my view.
Vladdy (like Ichiro) isn't a selective hitter - which makes his average even more impressive IMO.
If you compared stats like this in hockey, it wouldn't work so well, mainly because of quality of competition issues. To judge a player's offensive production, we must know his opposition.
In baseball, I don't know if they focus on this. Do we know the quality of pitching that Pujols faced as opposed to the quality of pitching that A-Rod faced?
I think we just assume they all faced about the same quality of pitching.
Oilman: Wasn't that Vladdy I saw the other day swing at a pitch about a foot outside the strike zone and two inches off the ground and somehow tomahawk the thing through the hole between short and third?
David: I would (loosely!) equate the quality of opposition pitching to the quality of opposition goaltending. Your stated assumption that the comped players face roughly the same quality of pitching over the course of a season would be a very good first-order guesstimate. Simply put, they both faced Major League Pitching.
Now to extend the pitching/goaltending analogy, it may be there are slight differences if one plays in a division rich with goaltending vs., say the SouthLeast, but if further resolution is required those things can actually be measured and "solved" with weighted averages and the like to counter unbalanced schedules. But that's way ahead of where we are now when it comes to comparables, which as Matt N pointed out does not yet include (to my knowledge) a defined group of statistics.
The Desjardins-style QualComp that you refer to is both exceedingly important in hockey, and has no apparent counterpart in baseball. The other team doesn't change its fielders depending on who is up to bat. :)
My own instinct would be to use QualComp as one element of the comparison; i.e. players who face similar QualComp are more comparable than players who don't. Alternately, players who produce similar results as their comparables but against tougher competition are likely superior players. (e.g. Hemsky > Nilsson) QualComp & QualTeam both would definitely be in that "basket" of stats to develop useful comps that I mentioned higher up in the comments section.
Speaking of which, that was me posting under "jemh" about Albert, Vladdy and Ichiro; I was using my sister's computer and obviously she was signed in. Sorry for confusing the issue.
I realize that Qual/comp is the best that we have right now but I am not really sold on it as a great tool. If I understand it correctly (and please correct me if I am wrong) it is generated off of the +/- stat. I would like to see some other type of formula put together with a more wide spread and inclusive look at a players worth. Then that formula could be used as quality of competition measuring stick.
Post a Comment